Biden administration launches website to provide real-time climate data, predict future scenarios

A first-of-its-kind climate resiliency website will help communities understand climate-related risks, the Biden administration said. The new website, launched Thursday, provides real-time information and predictions for local communities that are more vulnerable to disasters, such as wildfires, heat waves and droughts.
The website, known as Climate Mapping for Resilience and Adaptation, or CMRA, will help community leaders better plan for climate-related hazards, officials said. The website and corresponding maps streamline the federal government’s data at the national-level down to the census tract-level. Maps and charts show various climate hazards and potential future conditions under low- and high-emission scenarios for heat-trapping greenhouse gasses.
“It’s going to help communities, federal agencies and other levels of government better understand their exposure to climate hazards and strengthen their resilience plans,” said Richard Spinrad, the Under Secretary of Commerce for Oceans and Atmosphere and the administrator for the National Oceanic and Atmospheric Administration.
The website will become a first line of defense for the federal government to protect people, property and infrastructure from climate risks, Spinrad said.
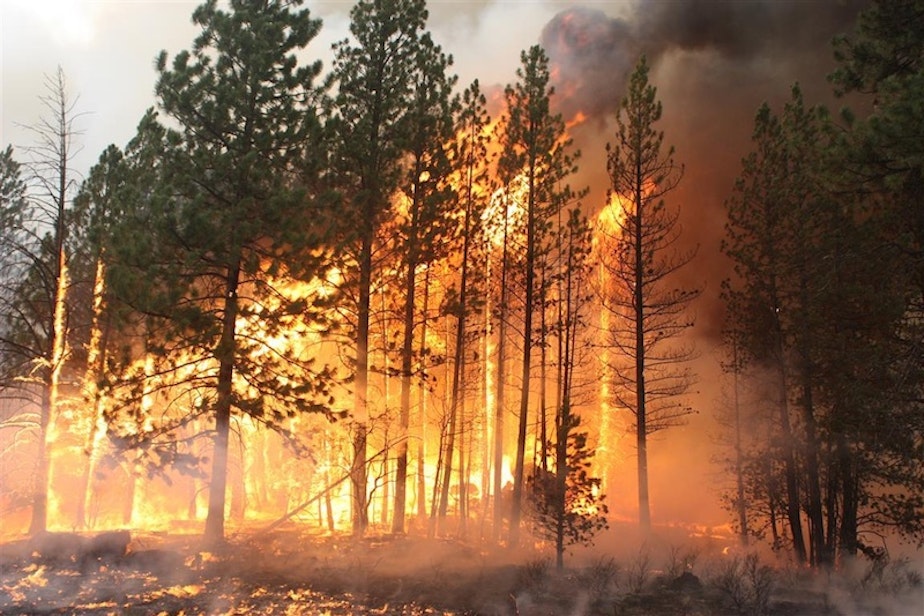
The website sorts climate risks sortable by different climate hazards. For example, the website and maps show current risks for wildfires. Zoom into the Northwest on the map, and a red zone around Spokane and Washington’s Palouse region shows the air quality is unhealthy.
Sponsored
Wildfires are harder to predict with the assessment tool, said David Hayes, special assistant to the president for White House climate policy.
“Wildfires can’t be modeled on a geographic basis with anywhere near the precision or modeling that extreme heat can or flood can,” Hayes said.
Therefore, the assessment tool relies heavily on temperature and precipitation predictions, although Hayes said the tool will be updated as new data becomes available.
In Spokane, the assessment tool predicted days reaching above 90 degrees would balloon in the coming years. Lower emissions scenarios predict 29.7 days, and higher emissions scenarios predict 31.5 through 2044.
The hot days increase even more from 2070 to 2099. Under lower emissions scenarios, there could be 45.1 days above 90 degrees. Under higher emissions scenarios, there could be 67.3 days above 90 degrees.
Sponsored
For coastal flooding, the assessment tool predicts portions of Skagit County could be underwater by 2090 as the sea level rises. By the late 21st century, at least .5% of the county could be inundated under lower emissions scenarios, and .7% of the county could be inundated under higher emissions scenarios.
That sort of information could help city, regional and state planners, Spinrad said.
“It’s the impacts on people’s health; the loss of power, for example, when there are rolling blackouts; the isolation of communities when roads are washed away; the rationing of water when there are shortages; and the destruction caused by wildfires that point clearly at why we need to be taking action now,” Spinrad said.
For example, Spinrad said, NOAA has tracked extreme weather and climate events since the 1980s. On average, there were three disasters costing around $20 billion each year in the 1980s. That average went up to 13 disasters in the decade starting in 2010, which cost around $92 billion each year, Spinrad said.
Predicting climate hazards would help people and the federal government manage and conserve the natural and built environment, Spinrad said.
Sponsored
To help manage the built environment, the maps show applicable building codes and the percent of people who live in a disadvantaged area, which officials said could help better direct resources.
The scientific information this website provides will help make important decisions about the future to help the most people in each community, said Phoenix Mayor Kate Gallego.
“This tool will help me understand the most effective places to put climate resilience dollars,” Gallego said.
In Oregon, state officials withdrew a wildfire risk map released in June after public outcry that it could raise insurance rates and lower property values, according to reporting from Oregon Public Broadcasting.
After the map’s release, the Oregon Department of Forestry received at least 750 appeals from property owners who argued their land had been erroneously placed in high-risk fire zones, according to OPB.
Sponsored
“For some people this could be catastrophic if they can no longer afford their homeowners insurance, and they could lose their home,” a Southern Oregon resident said at a virtual public information session, OPB reported. “Can anybody tell me how I’m going to be impacted financially? What’s going to happen with my insurance? No. … There’s no protection for the homeowners. There was absolutely no consideration for how impactful this could be.”
For the new risk assessment tools, federal government officials said they expect industry groups to use the open-sourced data, which could include insurance companies.
“This is data that we thought everyone should see for their own purposes. Our view is that it should be available and open-sourced,” Hayes said.
Moreover, that same data could help communities apply for federal disaster relief from FEMA, Hayes said.
“This will be used by communities to help describe their needs and put that in funding requests,” Hayes said, of the information the website can provide. [Copyright 2022 Northwest News Network]
